
Sign in now
Logout
|
You are signed in as guest Sign in now Logout |
 |
Plain Talk
|
||||
|
COVID‑19: Where’s the Risk?
From The Buxton Co The COVID‑19 pandemic hit the U.S. hard and fast, leaving organizations in all industries scrambling to assess the risk and take appropriate steps to ensure the safety of their employees and customers. At Buxton, we’re committed to providing clarity on critical business decisions. Because of our commitment, we immediately took action to develop a COVID‑19 vulnerability assessment for every ZIP code in the United States. This information can be used to help determine areas where additional healthcare surge capacity may be needed, where businesses not faced with mandatory closures may consider voluntary closures, and where government and other organizations may consider concentrating preventative efforts. In this blog post, we’ll summarize the methodology used in our calculations and share insights on geographic trends observed in the data.
Buxton classified all U.S. ZIP codes into one of five categories (quintiles) based on level of risk.
The formula we used to calculate each ZIP code’s level of risk is as follows:
COVID‑19 Risk: Are Urban Areas at Higher Risk? With news headlines focused on many of the major metro areas, it may be tempting to assume that urban areas are inherently more vulnerable. But is that really the case? Our calculations show that 14.5% of the total U.S. population resides in ZIP codes classified as highest risk. But if we view those results filtered by urban density, 15.7% of the rural population resides in highest risk ZIP codes compared to only 9.6% of the urban population. In other words, rural area populations have higher concentrations of highest risk people and urban area populations have lower concentrations of highest risk people. This same pattern is observed when we apply an additional filter: age. According to the data, 21.9% of the total population age 65+ in the U.S. resides in highest risk ZIP codes. When we view those results filtered by urban density, 22.8% of the rural population age 65+ resides in highest risk ZIP codes compared to only 15.8% of the urban population age 65+. Again, rural area populations age 65+ have higher concentrations of highest risk people and urban area populations age 65+ have lower concentrations of highest risk people. This may be driven in part due to less access to medical care in rural communities. COVID‑19 Risk: Are Certain Regions at Higher Risk? Next, we examined the data to see if there are any regions that have higher concentrations of high-risk areas. We split the results by U.S. census divisions. The following patterns stood out:
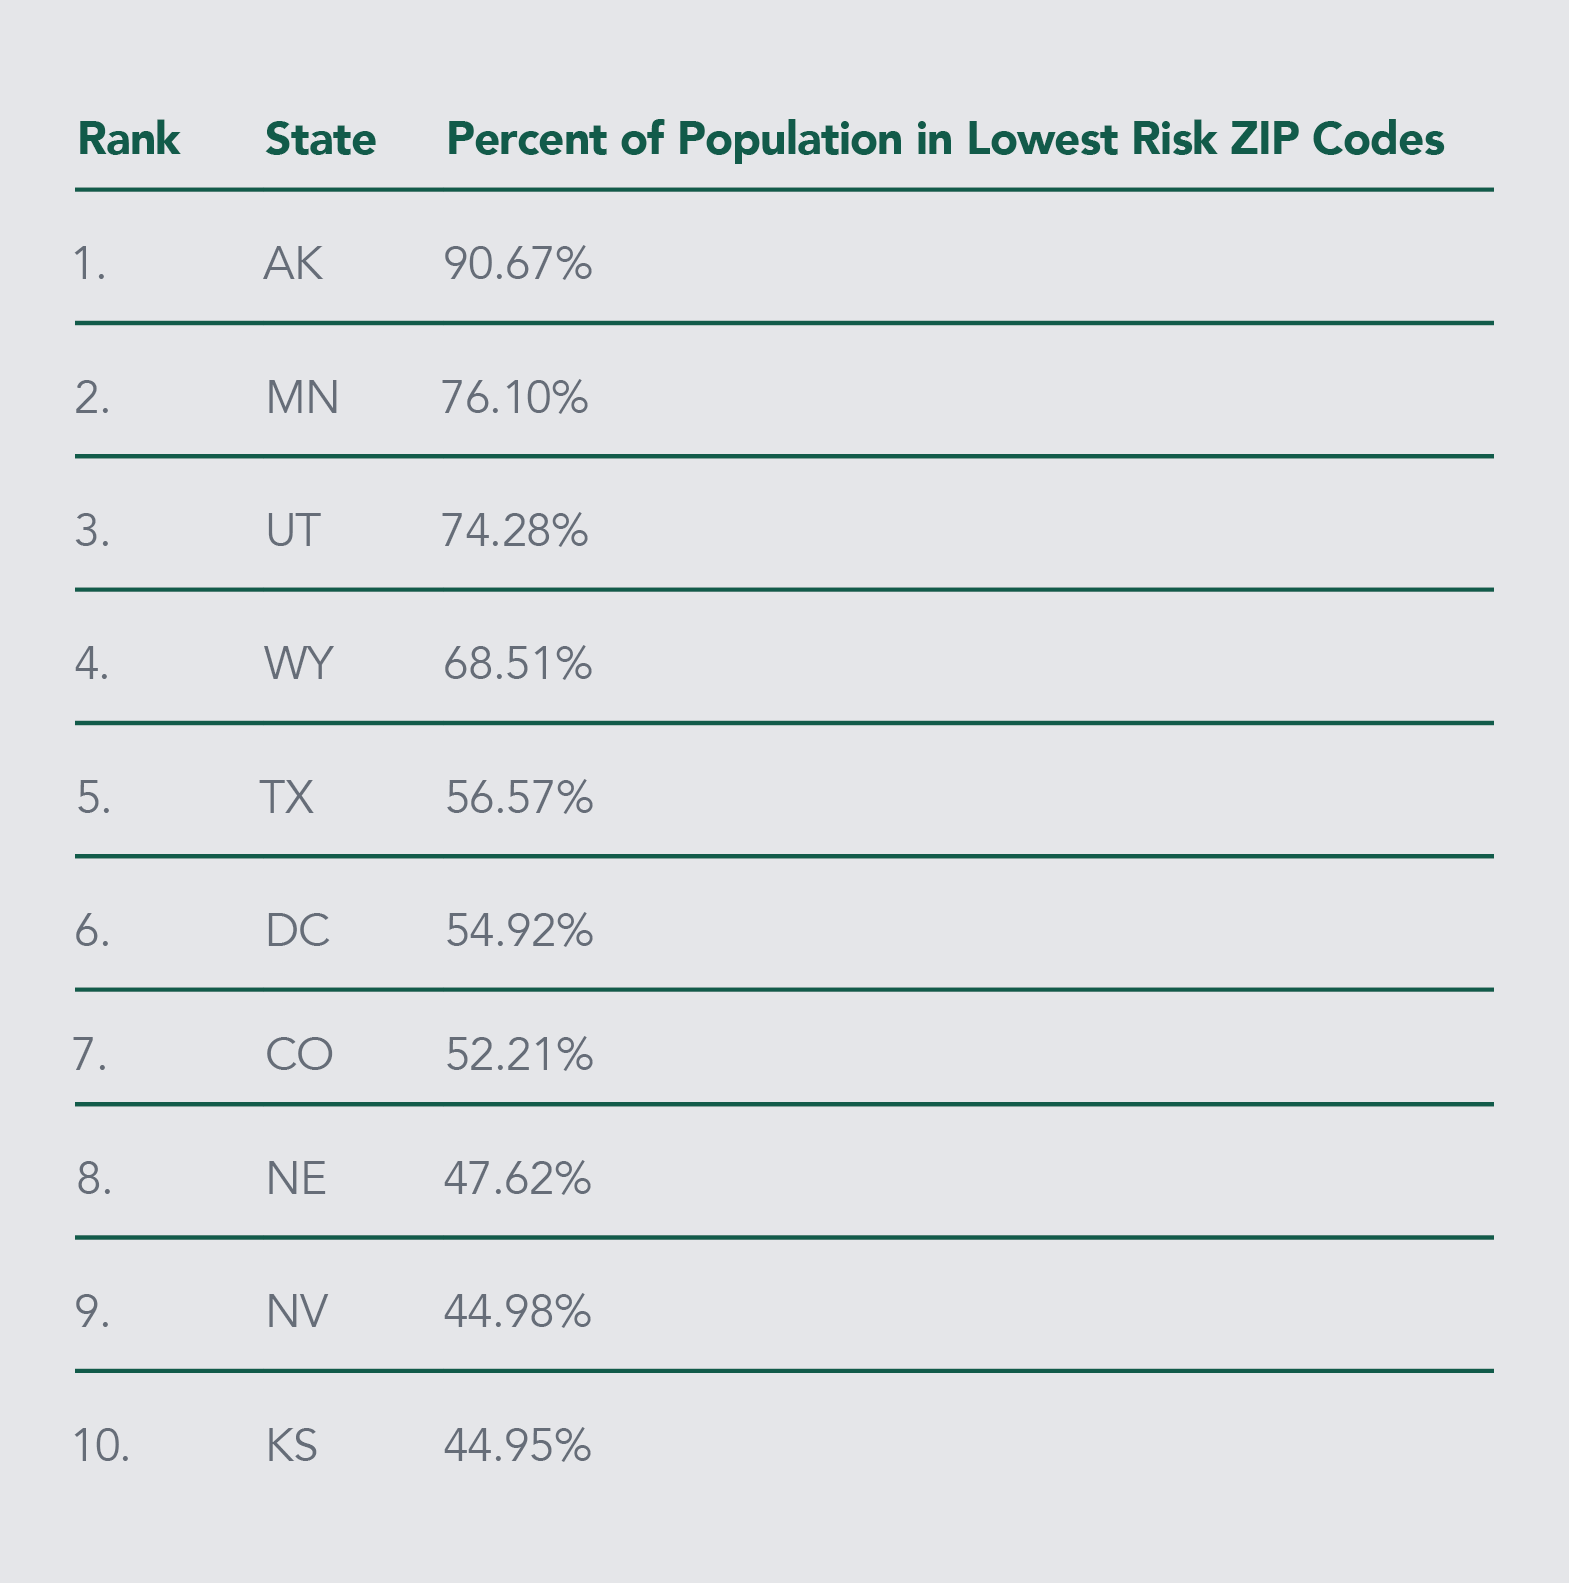
COVID‑19 Risk: Which States Have the Highest and Lowest Risk? Some states face a higher percentage of the population living in high-risk areas than others. We calculated the concentration of population in highest and lowest risk ZIP codes by state.
While 26.6% of the total U.S. population resides in one of the lowest risk ZIP codes (category 1 in Buxton’s rankings), these top 10 states have even higher concentrations of their population in category 1 areas.
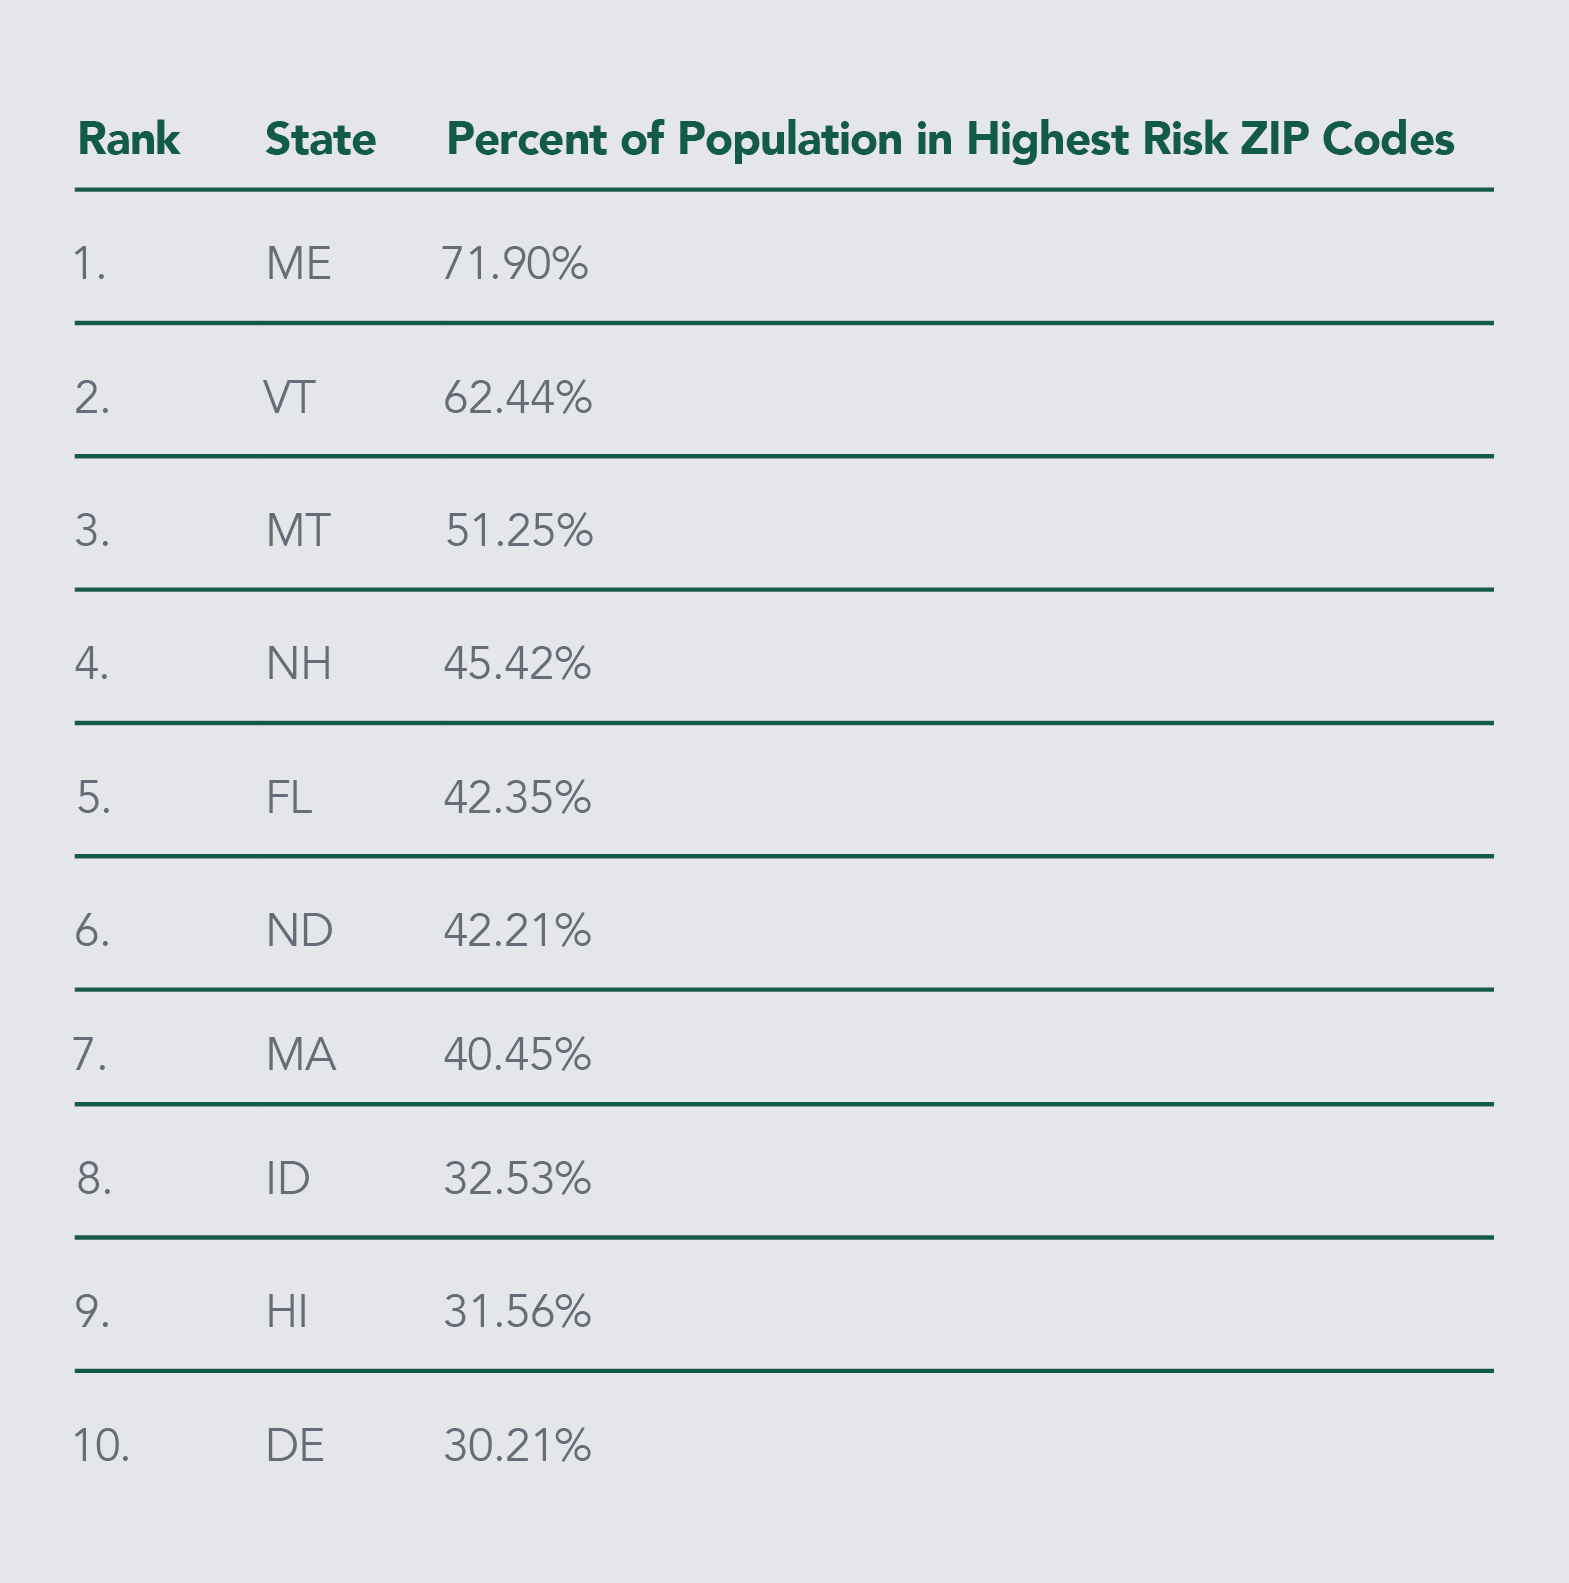
On the other hand, 14.5% of the total U.S. population resides in one of the highest risk ZIP codes (category 5 in Buxton’s rankings). These are the top 10 states that exceed that threshold.
The COVID‑19 pandemic may be changing life and business as we know it, but together we can make a difference. Understanding the risks in your markets empowers you to make better decisions. If your organization needs help answering questions during this crisis or throughout the recovery, we can help. Reach out to us today to start the conversation.
If you have an opinion on the retailing or retail real estate industries, take this opportunity to share your thoughts. Articles should run between 400 and 800 words. Topics can, be general in nature, consumer observation or specific to retail concepts or practices. Articles will be posted for at least one week and will then be placed in the Editorial Archives. All articles submitted will be read and considered but we cannot guarantee publication. Each published article will carry the submitters byline (if desired) and is a free service to our community. Article ideas and suggestions are also always welcomed. Contact PVS@PlainVanillaShell.com
|