Sign in now
Logout
|
You are signed in as guest Sign in now Logout |
 |
Plain Talk
|
||||
|
Help Your Franchise G.R.O.W.
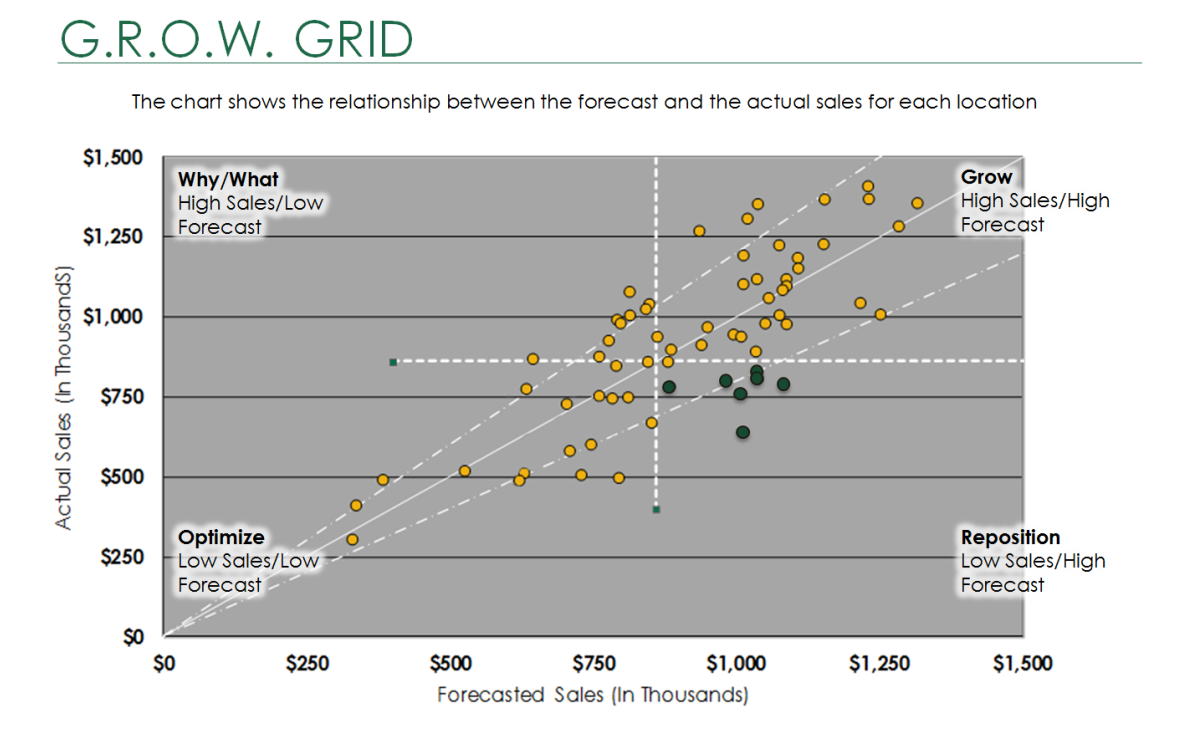
From The Buxton Co It’s a competitive market for franchisors today with large franchise groups experiencing periods of stagnation or even decline. However, there are small franchise groups that are coming of age and looking to play in the same space. And in the current retail environment, customer analytics separates the growing from the stagnant. By using a strategy we call G.R.O.W., which is centered around using the actionable information gleaned from customer data and analytics, it’s possible to identify locations that are performing well and variables that drive success. Those variables can include anything from the customer base around a location to the co-tenants, merchandise mix, or marketing messages. Utilizing the G.R.O.W. grid as seen below, position each store location into one of four quadrants based on its actual and potential performance. Then, implement specific growth tactics and strategies at each store depending on where it falls on the grid. The G.R.O.W. Strategy
The store locations that fall into the Growth quadrant are the best performing locations with large, loyal customer bases. Closely analyze these locations to isolate the exact variables that are driving success so you can replicate these factors in new and existing stores, where possible. • R Means Reposition The stores that fall into this quadrant are those locations that seem to have all the same characteristics as the stores in the growth quadrant but are not performing as well. In other words, despite having the key success factors, something is standing in the way of optimal performance for those locations. To identify those obstacles, carefully analyze and compare each of your reposition and growth stores. Is there a different merchandise mix? Are you spending more on marketing at one store versus another? Your analysis should uncover the obstacles to growth and subsequently the strategies and tactics you should use on these locations moving forward. These are the stores where investments of time and money would likely have a high ROI. • O Means Optimize The optimize locations have few characteristics in common with the growth locations. Maybe this is due to poor location visibility or because the customer base in the store’s trade area doesn’t match your best customer profile. Regardless of the reason, these stores are simply not performing well – and no matter how many resources you throw at these stores, they are still not likely not perform well because they don’t share the same characteristics as your growth stores. You must accept the fact that the options for these stores are limited. Either you close the store, relocate the store, accept the weaker revenue numbers, or analyze the surrounding customer base and change the merchandise mix to be more appealing to them. But, whatever you do, don’t spend much of your time or money attempting to turn the optimize stores around. • W Means Why/What To put it simply, the why/what stores are anomalies. These are stores that should not be performing well as they don’t share the characteristics of your growth stores, but continue to deliver strong numbers. The key step to take for why/what stores is to identify the factors that are driving their success – even though, in all likelihood, the factors won’t be duplicable at other stores. In these instances, it’s best to let these stores be, while keeping an eye on competition. The Bottom Line The assessment of existing store performance can identify which stores are not meeting their potential, making it possible to immediately reprioritize resources such as management, remodeling funds, and marketing from the stores with no upside to the ones that are underperforming.
|